Which Stochastic Volatility Model Forecasts Best?
Based on Chan (2013)
[ Journal Version | Working Paper | Code | Full tutorial on GitHub ]
Chan and Grant (2016)
[ Journal Version | Working Paper | Code ]
We compare five stochastic volatility models by their one-day-ahead forecasts of the return on the dollar-euro exchange rate. The log predictive likelihood and the coverage of predictive intervals assess the predictive distribution. QLIKE and the mean squared error (MSE) assess the forecasts of the squared return.
The comparison starts with a standard SV model: normal errors and a stationary AR(1) log-volatility. We then consider Student-t errors, a random-walk log-volatility and an MA(1) term in the return equation. Together with the baseline, these changes give five models: SV, SV-t, SV-RW, SV-RW-t and SV-MA. The sample runs from 5 January 1999 to 13 November 2026. We evaluate the forecasts over the last 1,761 business days, from 2 January 2020. Before each forecast, we re-estimate every model on all earlier returns.
SV-t has the highest log predictive likelihood and the lowest QLIKE and MSE. Its log predictive likelihood exceeds that of SV by 26.6, more than four standard errors. The evidence from QLIKE is weaker: the QLIKE of SV-t is lower than that of SV by 1.7 standard errors. The random-walk models have slightly lower log predictive likelihoods than their stationary counterparts. The MA(1) term raises the log predictive likelihood of SV by 0.3.
The benchmark is the exponentially weighted moving average (EWMA) of RiskMetrics. All five models have a higher log predictive likelihood than the EWMA, by more than three standard errors. For SV-t, the difference is 79.1. Most of it comes from a few days with large moves (Figure 1). The QLIKE of the five models is lower than the EWMA's by 1.6 to 2.1 standard errors. Their mean squared error is lower by at most 1.4 percent.
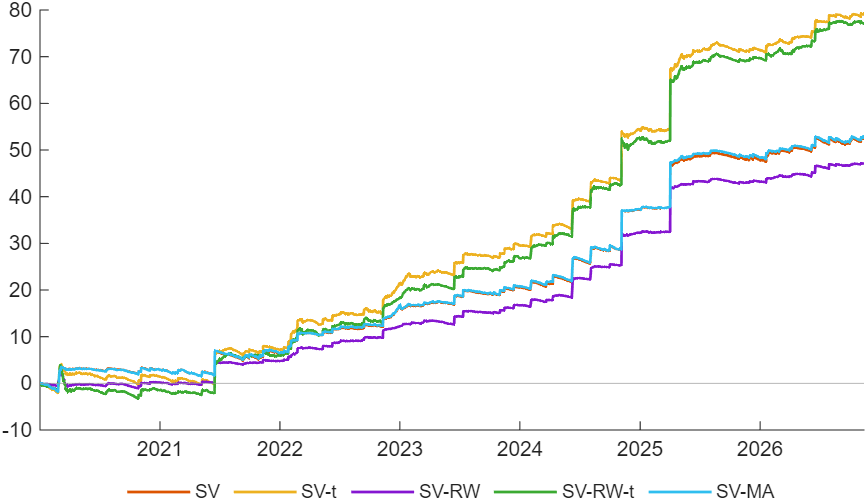
Figure 1: The cumulative difference in log predictive likelihood of each stochastic volatility model against the EWMA, plotted at the target day. Each line rises on a day when the model's predictive density at the outcome exceeds the EWMA's. The lines of SV and SV-MA almost coincide. The largest jumps are on 6 November 2024 and 3 April 2025.
Try it
In MATLAB, from the root of a copy of statespace-toolkit:
run tutorials/sv_volatility/your_data.m: the comparison on the same data over the last six days, with short chains, each model's forecast for the day after the sample, and the exported report (about a minute)run tutorials/sv_volatility/build.m: every number and figure in the full tutorial (about 10 hours with 10 parallel workers)