Explore the Estimates
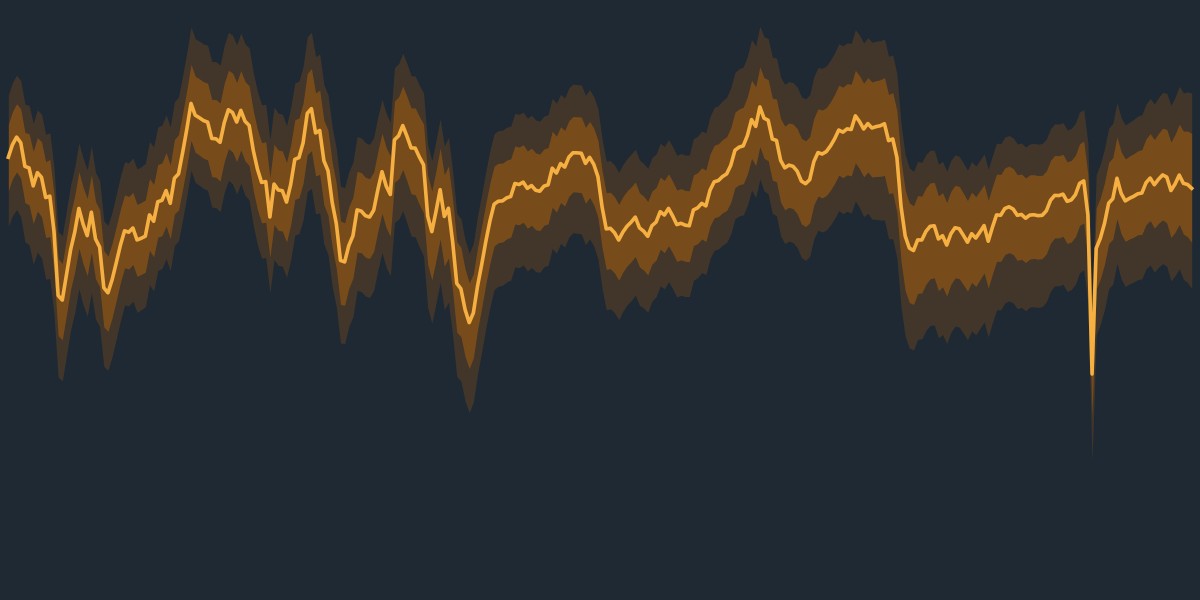
Compare the six models' estimates of US trend inflation, the output gap and trend output growth, choose a credible band and a period, and hover over the chart to read any quarter. The data are read from the latest release of trend-cycle-toolkit, so this page shows each new release as soon as it is published. The estimates page has the files, and the models page sets out what each model assumes.
Models
Band
Period
Loading the latest release from GitHub…
What does each model assume?
Lines are posterior means and bands are equal-tailed credible intervals. Shaded areas mark NBER recessions, from peak to trough. Please cite the paper behind each model, listed on the estimates page.