
How to Evaluate Forecasts Out of Sample
Guide 3 of 4 in the series Forecasting with a VAR
Based on Bayesian Macroeconometrics (Chan, forthcoming)
[ Full guide on GitHub ]
A forecasting model is judged by the forecasts it would have made in the past, each from the data available at the time. In this guide we evaluate the BVAR of How to Forecast with a Bayesian VAR on the sample of the series. At the end of each quarter from 120 to 239, we estimate it on the data up to that quarter and forecast one and four quarters ahead. We score the point forecasts by the root mean squared forecast error, the density forecasts by the log predictive likelihood, and the intervals by how often they contain the outcomes. We use an AR(4) for each variable as the benchmark, and we also score the forecasts of the true model, made with the true parameters. One quarter ahead, the forecasts of the BVAR are more accurate than those of the AR(4) for all three variables. Four quarters ahead, they are more accurate for unemployment.
The steps
- Forecast at Each Origin with the Data of the Time
- Score the Point Forecasts
- Score the Density Forecasts
- Check the Intervals
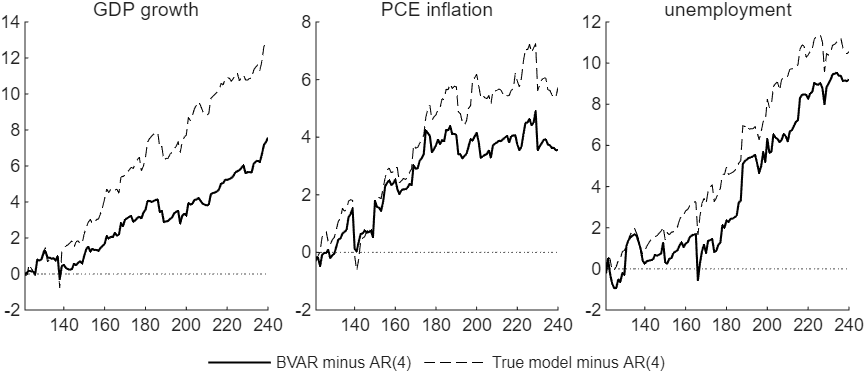
Figure 1: The cumulative sum of the log score of the BVAR and of the true model minus that of the AR(4), one quarter ahead, against the quarter forecast.
Try it
In MATLAB, from the root of a copy of bvar-toolkit, run the script that prints every number and draws every figure of the guide:
run guides/var_forecast_evaluation/guide.m
In this series
Previous: How to Forecast with a Bayesian VAR
Next: How to Choose the Lag Length and the Shrinkage for Forecasting