Does the Order of the Variables Change My VAR Results?
Based on Chan, Koop and Yu (2024)
[ Journal Version | Working Paper | Code | Full tutorial on GitHub ]
In this tutorial we examine whether the order of the variables affects the estimates and forecasts of a VAR with stochastic volatility. Under the popular Cholesky specification of Cogley and Sargent (2005) it does, and the effect is larger in a larger VAR. In the 20-variable VAR of Chan, Koop and Yu (2024), reversing the order of the variables changes the typical error variance by 16% of its level and moves the estimated correlation between the PCE inflation and PPI finished goods equations from about 0.82 to about 0.19 (Figure 1). The order-invariant specification of Chan, Koop and Yu (2024) gives the same estimates under both orders, up to Monte Carlo error. The ordering matters much more for density forecasts than for point forecasts.
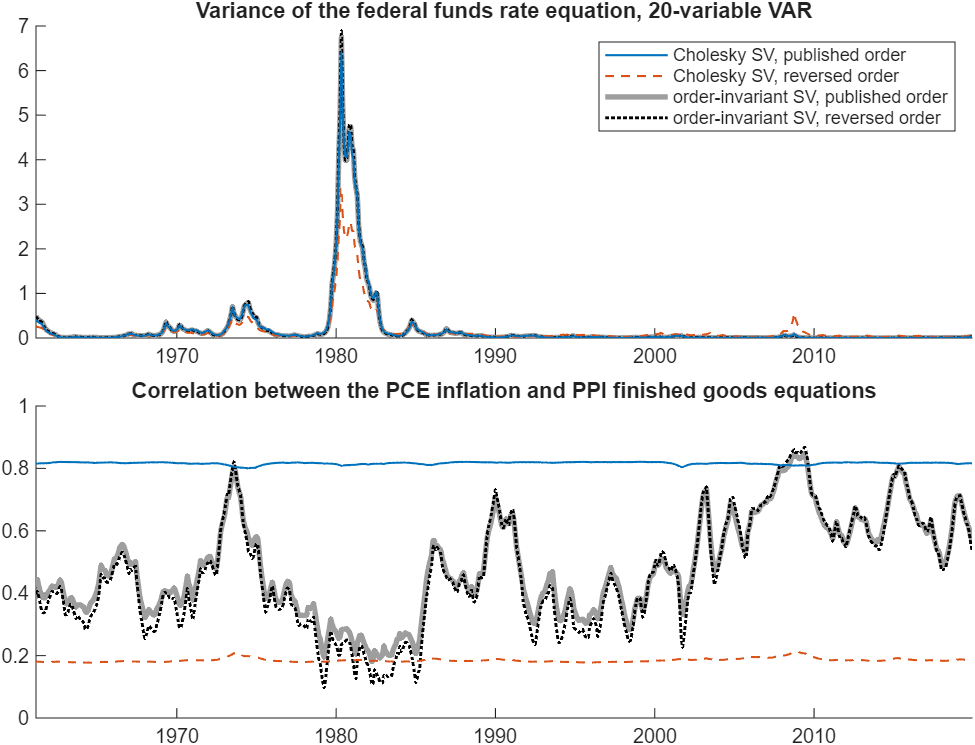
Figure 1: Posterior mean of the variance of the federal funds rate equation (top panel) and the correlation between the PCE inflation and PPI finished goods equations implied by the posterior mean of Σt (bottom panel), 20-variable VAR. The solid blue and dashed red lines are the Cholesky model in the published and reverse orders; the thick gray and dotted black lines are the order-invariant model in the published and reverse orders.
Try it
In MATLAB, from the root of a copy of bvar-toolkit:
run tutorials/variable_ordering/your_data.m: the comparison on the four series of ex06 with short chains (about 30 seconds)run tutorials/variable_ordering/build.m: every number and figure in the full tutorial (about 23 minutes)
Related tutorials
- How Should I Choose the Shrinkage Hyperparameters of My BVAR?
- Which Stochastic Volatility Specification Should My VAR Use?
- Does Modeling the Volatility Improve My Forecasts?